Data Visualization
Gain Additional Insights by Powerful Data Visualization
Data Visualization
Display the Collected Data in Many Possible Ways
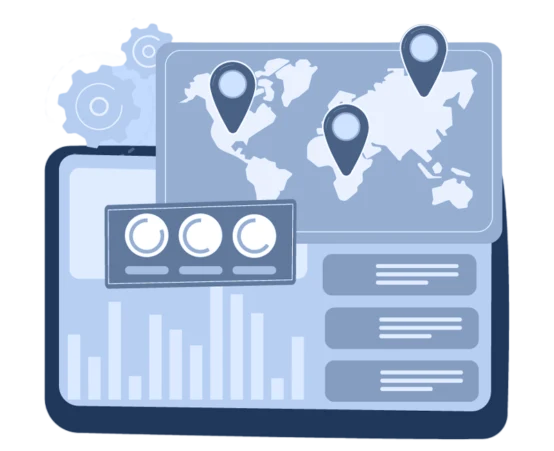
Define widget-based dashboards displaying relevant information:
- Large selection of many different widgets
- Simple drag and drop placement and scaling of widgets
- Each widget is highly customizable to fit your needs
- Display metrics, problems, infrastructure and geo maps on your dashboards
- Display your current business service SLA information on your dashboards
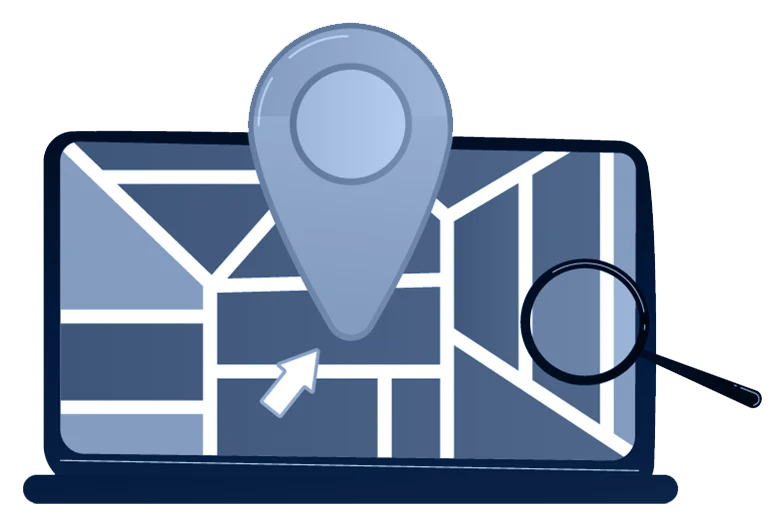
Keep Track of Your Monitoring Targets on an Interactive Geo-Map
- Select from multiple geo-map providers
- Display a geographical overview of your environment on Up or Not dashboards
- Access any of your monitoring targets from the geo-map
- Group your monitoring targets into a cluster on the geo-map
- Follow the status of individual monitoring targets or the whole cluster
Present Status of Your Infrastructure on Maps
Display statuses of your elements together with real time data to get a detailed overview of your infrastructure on a Up or Not map:
- Ability to display any data in real time on your maps
- Easy drag-and-drop map element deployment
- Clone and modify existing maps
- Execute scripts within your infrastructure from the map screen
- Create multi-level maps with submaps
- Context-based interaction with map elements
- Create linkages between map elements
- Create nested maps - change the scope of your current view with a click of a button

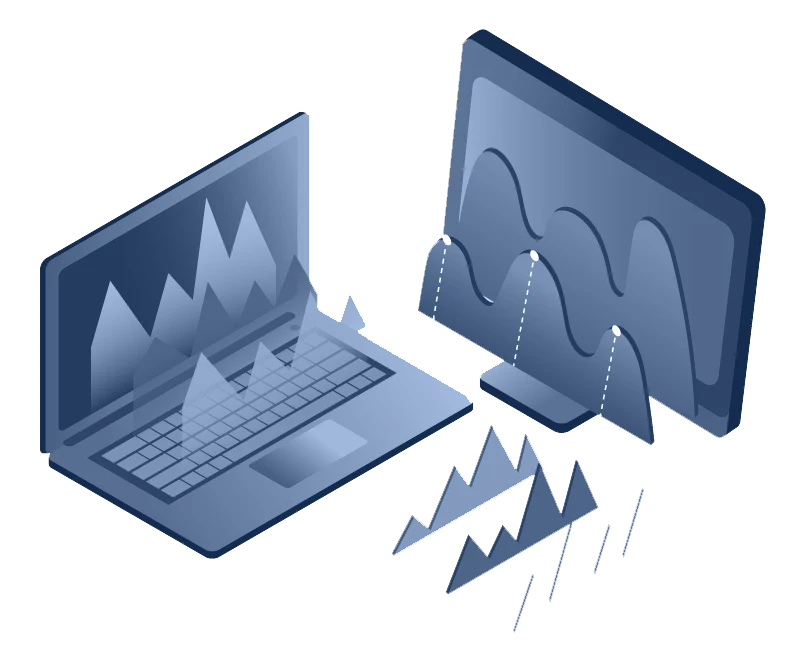
Analyze and Correlate Metrics With Graphs
Define custom graphs or access ad-hoc graphs with a click of a button:
- Multiple graph types
- Displaying of problems on the graphs
- Flexible time navigator
- Display single or multiple metrics with a click of a button
- Use of trend data for long term data overview
- Display aggregated data graphs
- Export graphs as images
- Display history data for any period of time
Generate Scheduled PDF Reports
Receive scheduled PDF reports providing useful statistics of your environment:
- Get reports delivered straight to your Inbox
- Can be scheduled for daily, weekly, or monthly delivery
- Notify your customers about their infrastructure health
Now any Up or Not dashboard can be turned into a PDF report!